filter and orange snippets in graph view
In graph view it would be helpful to filter the snippets, and also have the snippets arranged in accordance with a selected outline in which they are linked.
Re: filter and orange snippets in graph view
The graph visualization generated by Keypoints always shows the currently displayed notes. I.e., similar to the notes list, the graph gets always filtered by any item(s) selected in the filter view and/or any search terms entered above the notes list. See this 1-minute screencast for an example.
Since the graph visualization shows all links between notes as connecting arrows ("edges"), notes that belong to an outline (aka "overview note" in Keypoints terminology) will be always grouped around that overview note. As an example, here's a detail from a larger graph which shows all notes belonging to an overview note (the red one in the center) being grouped around that overview note:
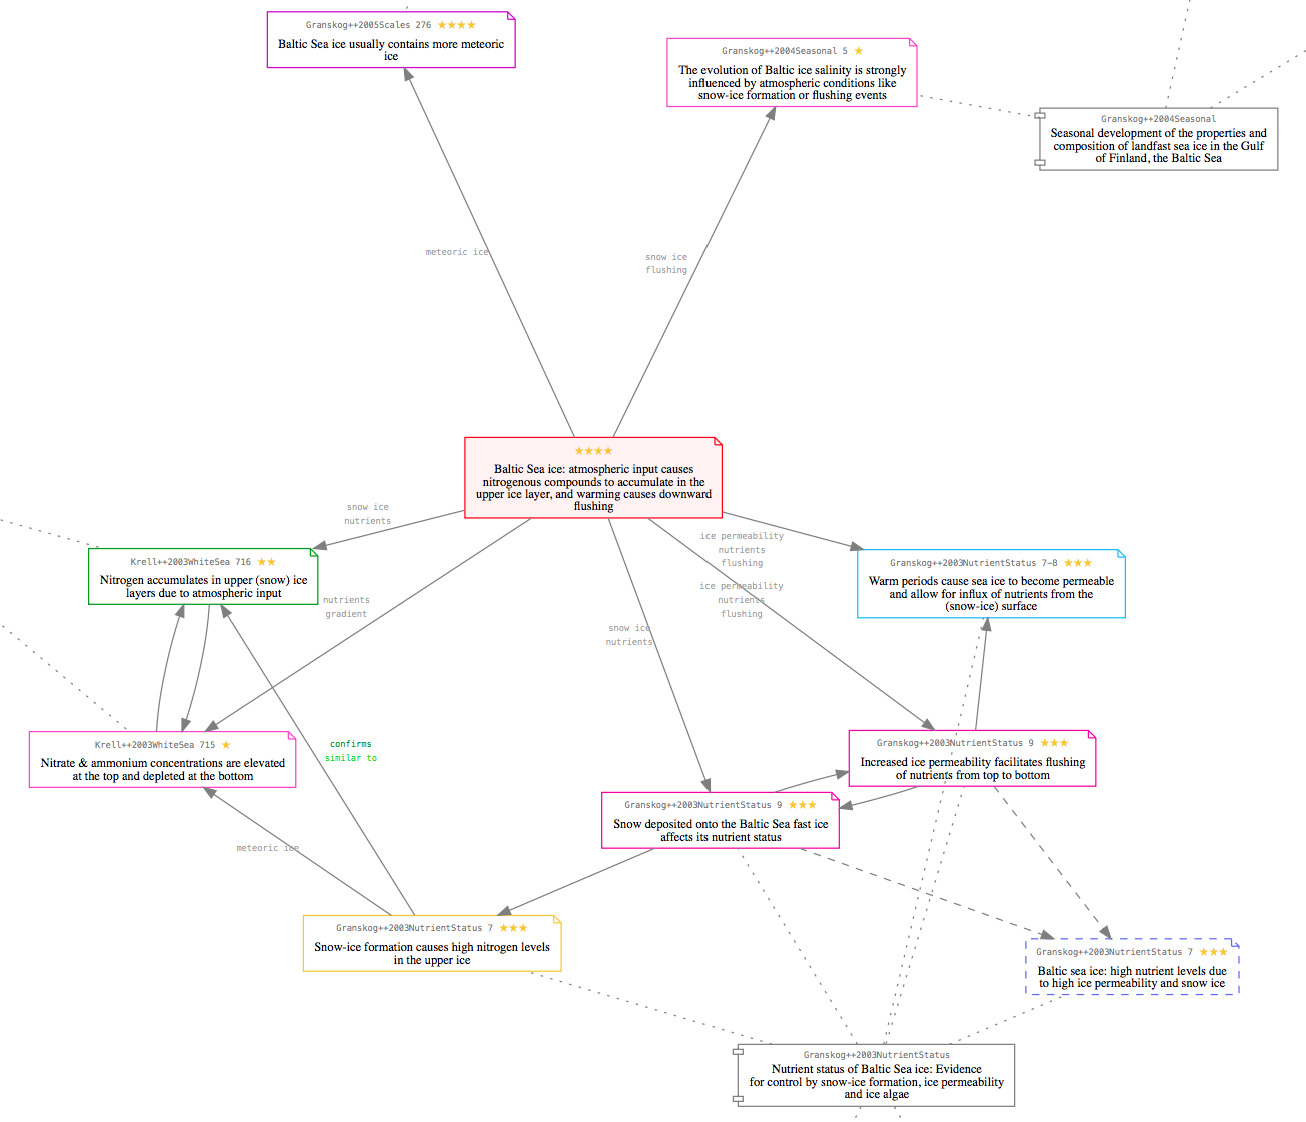
In the above graph, notes are also connected to their source publications. So notes belonging to the same paper will also be positioned closer to each other.
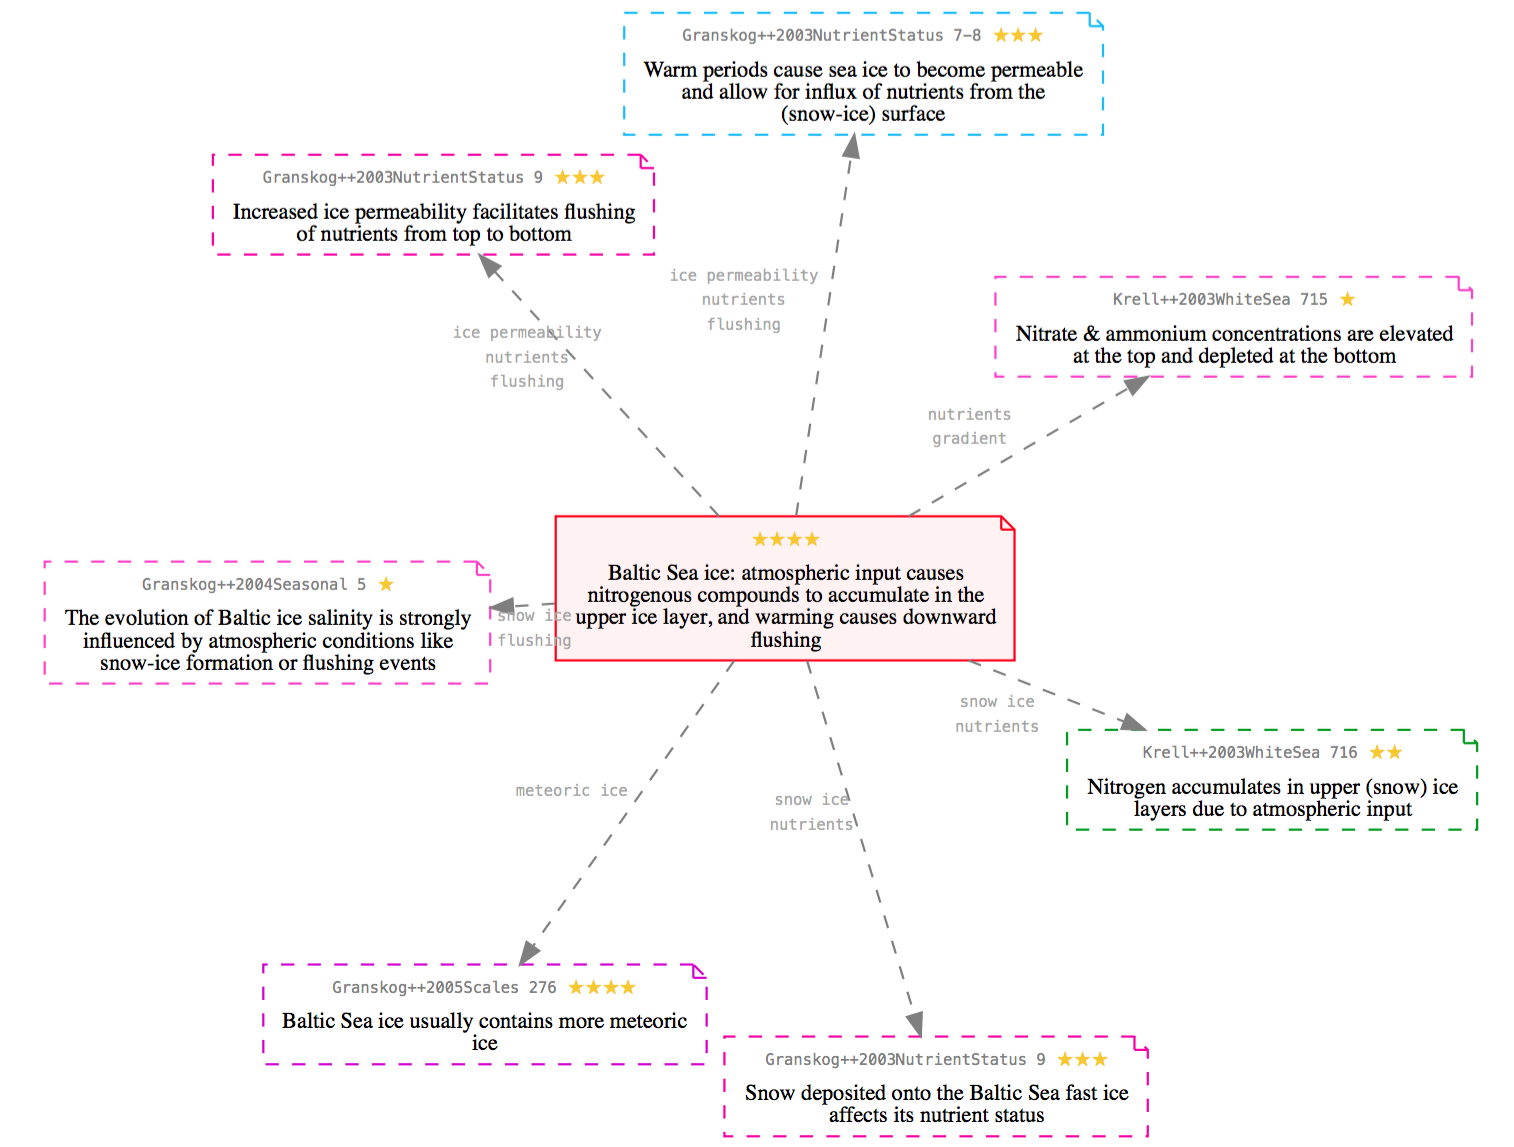
If you only want to see a particular overview plus any notes linked within that overview: Select the overview, and hit cmd-Return. Or simply cmd-click that overview note in the graph. This will enter the note's ID into the search field above the notes list. As a result, the app only displays note(s) containing that ID, plus all notes linked from the displayed note(s). Taking the above example, the graph would then look like this:
In any case, you can click the "Go Back" button above the notes list (or hit ctrl-left arrow) to reestablish your previous selection(s) and search term(s), which will of course also update the graph to the previous view.
Re: filter and orange snippets in graph view
Thats really nice to see!
Could you then also rearrange a few notes and lock the position?
Could you then also rearrange a few notes and lock the position?
Re: filter and orange snippets in graph view
Thanks. With the current graph visualization engine (Keypoints currently uses Graphviz), I fear that's not possible. Currently, a given set of notes in the graph even isn't guaranteed to get arranged in the same way between different invocations, and I haven't yet found a way to make the arrangement more consistent. There may be ways to improve things, but it likely won't allow for manual overwrites.
In the distant future, one could maybe use the graph engine to calculate the initial positions of the notes in the graph, then use this info to draw everything natively. This might eventually allow what you're after but this is likely several months of full-time work (if it would work at all), and thus nothing I can tackle now.
That said, I'd also love if one could control, override and/or customize the generated graph in more detail.